Interactive storytelling 2025
The Palisades Fire, visualized
The framework behind a geographic story
I developed the complete scrollytelling framework behind OroraTech’s Palisades Fire story, connecting geographic data with a narrative that unfolds as you scroll.
Read the original story (opens in a new tab)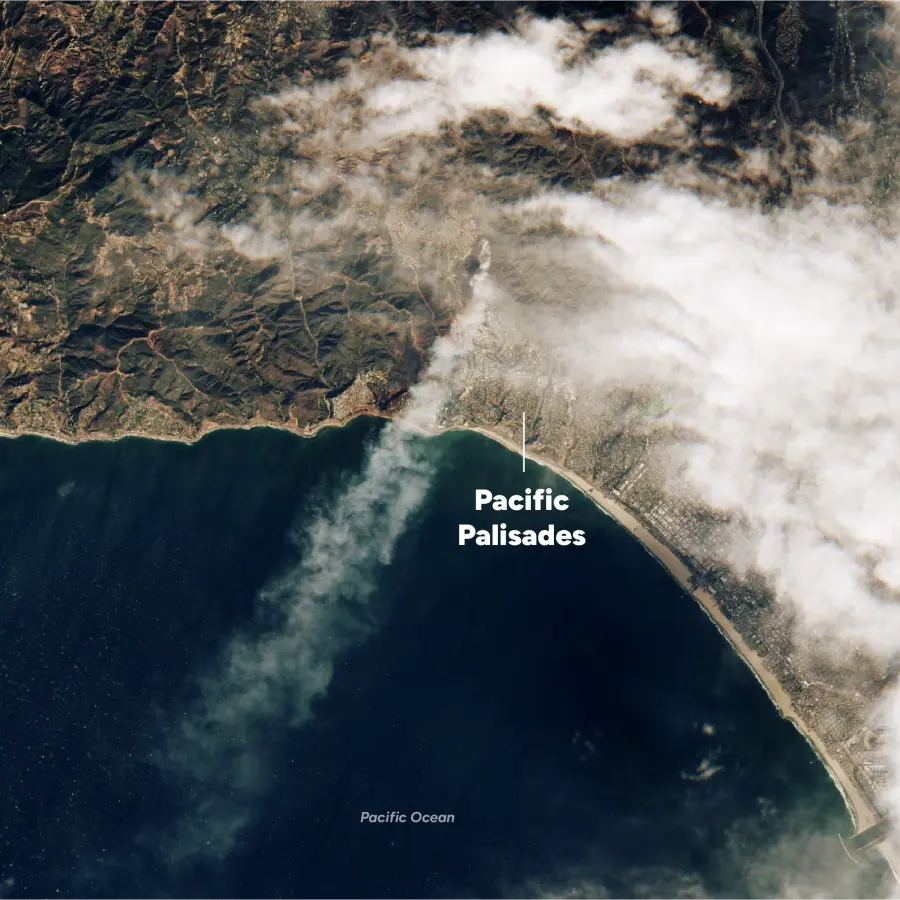
The story behind the map
I developed the complete framework for the Palisades scrollytelling project on OroraTech’s website, using MapLibre and Scrollama.
I built the framework and the geographic visualization, and developed the story and research in collaboration with Zach Ricklefs.
The published story moves through the fire’s progression, response, and recovery. The map changes with the narrative, giving each part of the story its geographic context.
Read the original story (opens in a new tab)Behind the story
Scrollama connects the reader’s progress with the visual sequence. MapLibre provides the geographic view. Together, they let the story move between places and scales without asking the reader to navigate a separate map.
Credits & publication
This case study documents my framework development. The interactive story is published by OroraTech. I developed its story and research in collaboration with Zach Ricklefs. Project imagery and data retain their original attribution.