3D cartography Day 12 · Time and space
Where people move
Japan Population Changes
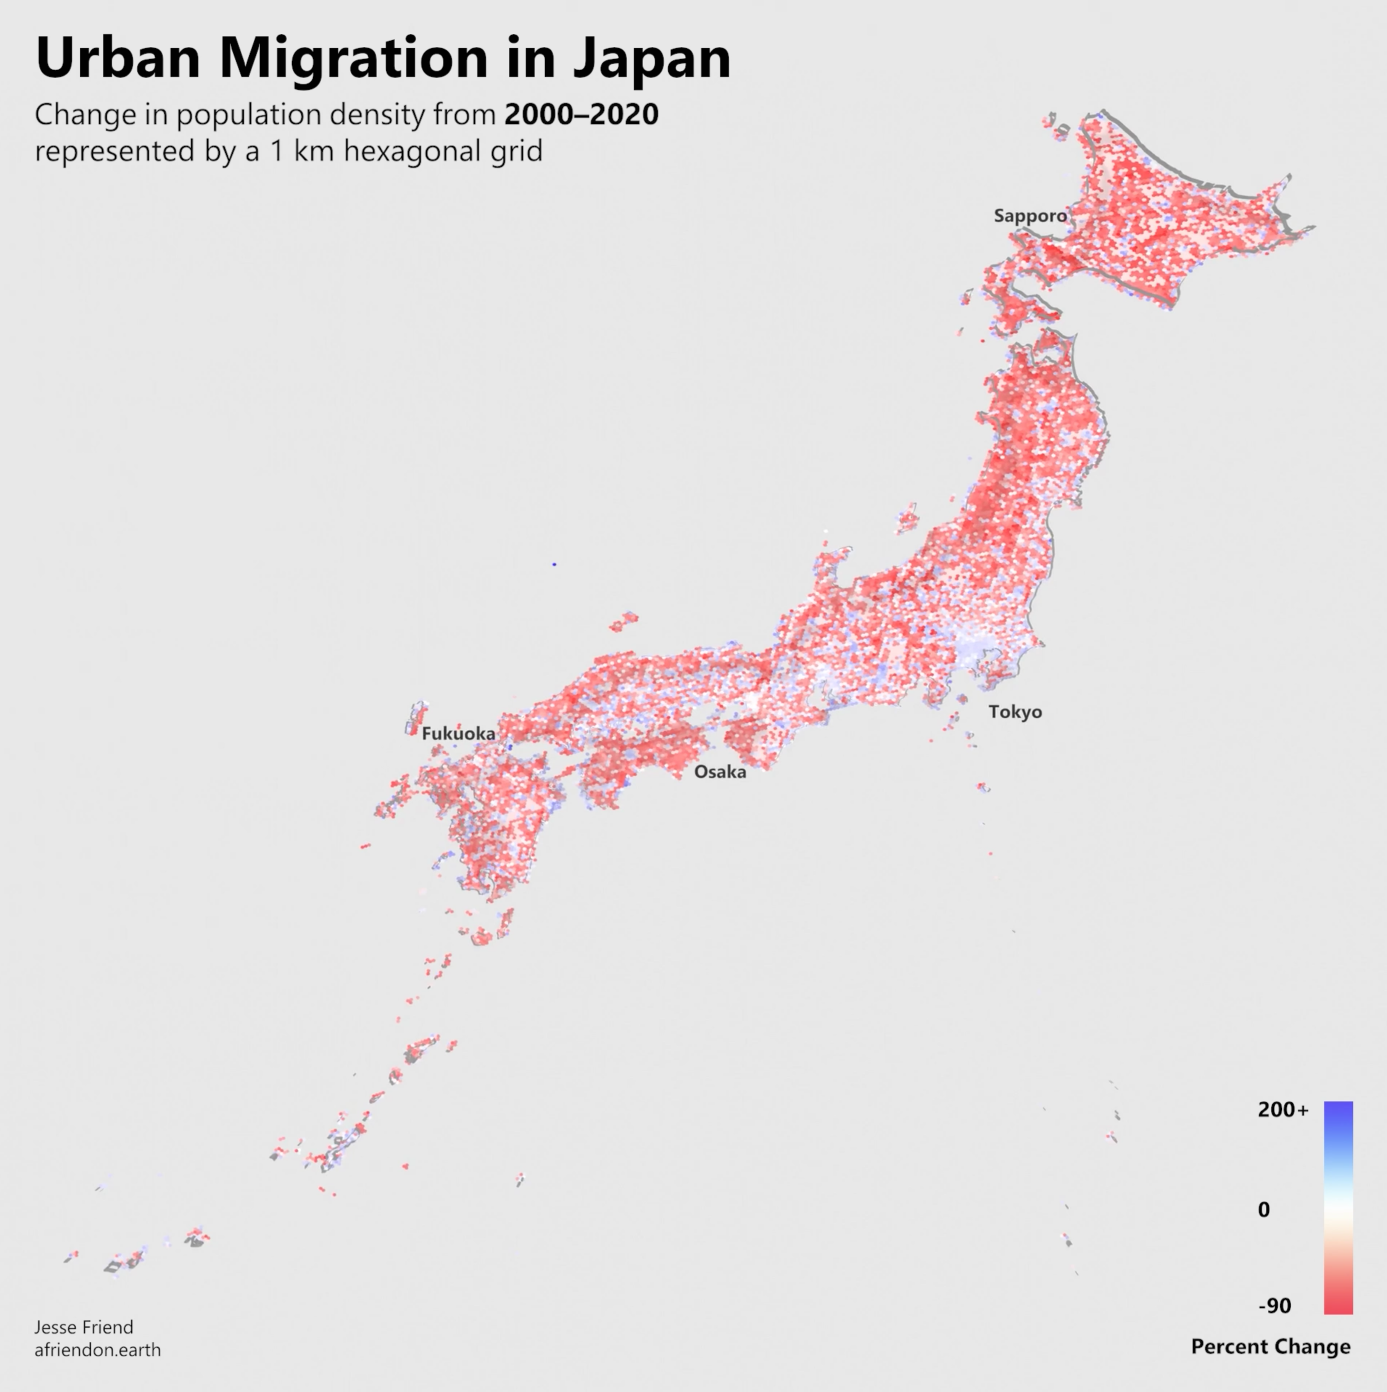
A look at the movement of people from rural Japan toward its urban centers, expressed through a three-dimensional map.
A closer look
Country-wide population figures can hide what changes locally. This project looks at the difference in population density across Japan between 2000 and 2020.
I used Blender to create and render the map, with population data from WorldPop. The project began as an exploration of time, space, and a new tool for the 30 Day Map Challenge.
The map in three dimensions
Read the transcript
The video has no audio. A 3D hexagon map of Japan turns against a light background. Each 1 km hexagon shows the change in population density between 2000 and 2020: red hexagons lost population, and blue hexagons gained it.
The camera moves from a top-down view to a low side angle, where gains rise above the surface and losses fall below it, then returns to a map view labeled with Sapporo, Tokyo, Osaka, and Fukuoka.
Rendered in Blender. Population data: WorldPop.